World Review of Nutrition and Dietetics, Vol. 12, pp.
1-42
(Karger, Basel/München/New York 1970)
Nutritional and Epidemiologic Factors Related to Heart
Disease1
J. BROWN (Deceased), G.J. BOURKE, G.E. GEARTY, A. FINNEGAN,
M. HILL, F.C. HEFFERNAN-FOX, D.E. FITZGERALD, J. KENNEDY, R.W.
CHILDERS, W.J.E. JESSOP, M.F. TRULSON (Deceased), M.C. LATHAM, S.
CRONIN, M.B. McCANN, R.E. CLANCY, I. GORE, H.W. STOUDT, D.M.
HEGSTED and F.J. STARE
Department of Nutrition, Harvard School of Public Health,
Boston Massachusetts and
Department of Social Medicine, Trinity College School of
Medicine, Dublin, Ireland
Synopsis
I. Study design and methods
II. Results
III. Discussion and Conclusions
Summary
References
1Supported in part by a grant from the National
Heart Institute (HE-06892), the Fund for Research and Teaching,
Department of Nutrition, Harvard School of Public Health, and
funds from the Department of Social Medicine, Trinity College
School of Medicine.
The Ireland-Boston Heart Study has been conducted jointly by
the Department of Nutrition of Harvard University in Boston and
the Department of Social Medicine of Trinity College, Dublin,
Ireland. A preliminary progress report has been published [1].
The study seeks to examine various epidemiological factors which
have been shown to be related to atherosclerotic heart disease
and to make comparisons of these in persons of Irish stock living
in different environmental situations.
At the time this study was designed the intake of dietary fat
was the main factor implicated in atherosclerotic heart disease.
In the intervening years our understanding of the role of this
factor has been somewhat modified and several other factors, such
as lack of physical activity, cholesterol content of foods,
cigarette smoking and obesity, have been implicated. Also during
these years new nutritional associations have been suggested
including those of high sugar [2] and low fluoride intake [3].
Most authorities agree that there are multiple risk factors and
that although the etiology of coronary disease is not
established, these several factors contribute either to
protecting the individual from or increasing his susceptibility
to heart disease.
The factors believed to be involved are nutritional (including
the intake of total calories, cholesterol, certain fats and
carbohydrates, fluoride, magnesium and possibly others),
cigarette smoking, activity, and social class. As well as these
variables which to some extent are capable of manipulation, there
are certain factors in the individual himself which appear to
determine his liability to the disease. These include sex, age,
serum cholesterol, serum lipids, blood pressure, obesity (as
shown by skinfold thickness, relative weight, ponderal index,
etc.), body build, behavior and personality factors, ECG
abnormalities, the presence of diabetes and other hormonal or
endocrine disturbances.
It is clear that some ‘risk’ factors are indeed
clinical signs and that these ‘signs’ may be
dependent on other risk factors. Thus, serum cholesterol levels
can be altered to some degree by diet; abnormal ECG findings may
be due to hypertension or may be an actual manifestation of
coronary disease; and obesity is related to dietary intake and
caloric expenditure. There is therefore, a complicated web of
environmental factors acting on, and of inherent factors existing
in the individual, all of which in some way appear to affect his
chances of suffering coronary heart disease.
At the present time, because we do not know the precise
etiology of the disease we tend to believe that many of these
factors are causal. As in the case of other complex diseases
whose cause was previously unproven, these related factors might
fall logically into place once the exact etiology has been
determined. At present it is helpful to consider these several
factors, to relate one to another and, using epidemiological
methods, hopefully to get nearer to the answer. This approach may
also be fruitful, in suggesting logical preventive measures. When
malaria was still thought to be due to bad air from swamps,
deaths from malaria were prevented by re-locating people in the
hills, and a century before the discovery of vitamins, scurvy was
eliminated from the British navy by the use of lime juice. In the
same way preventive measures may successfully be implemented
against coronary disease before its precise etiology is
proven.
In the Ireland-Boston study, many of these ‘risk’
factors, environmental, dietary, and physical have been
investigated. Because of the detail in which data have been
collected it has been possible to consider theories of etiology
which have arisen subsequent to the design of the study. The use
of the computer has allowed the consideration of many
correlations which it would have been impractical to consider
without this tool. Only some of these appear in the results in
this paper.
From many geographic studies relating to atherosclerotic heart
disease it has been shown that very different rates, both of
mortality and morbidity, occur in different parts of the world. A
partially successful attempt has been made to fit these into the
pattern of risk factors found in different countries. Thus, a
high consumption of saturated fats has been found mainly in those
countries where coronary heart disease is common and in these
same places high mean serum cholesterol levels are found in
middle aged men. This type of evidence has been to some extent
contradicted by later findings in which persons (such as the
Masai in Tanzania) with a high intake of saturated fat were found
to have low serum cholesterol levels and presumably little
coronary heart disease [4]. This type of evidence had led some
workers to believe that certain peoples, like the Japanese and
the Masai, are innately less liable to develop atherosclerotic
heart disease than are, for example, most Caucasians. This would
imply that there are very significant hereditary or racial
factors involved and that environmental and dietary factors are
less important. However, the Japanese who have migrated to the
United States have higher serum cholesterol levels and more
atherosclerotic heart disease than do their compatriots in Japan
[5-7].
The Ireland-Boston study was designed to get around this
particular difficulty by eliminating racial and to some extent
broad hereditary differences while at the same time ensuring
considerable environmental variation by taking for the core study
brothers who live several thousand miles apart. No study of
atherosclerosis has to our knowledge used this technique,
presumably because of the difficulties inherent in undertaking
such a study.
I. Study design and methods
It is known from vital statistics reports that mortality from
arteriosclerotic heart disease (classification 420-422) is higher
for males aged 45-64 in the United States than in Ireland.
Because there are a large number of Irish immigrants in Boston a
study was designed in which men born in Ireland but living in
Boston were compared with brothers who had remained in Ireland.
Comparisons were made of dietary, physical and certain other
factors which might be related to atherosclerosis. Accordingly,
through publicity Irish born men in the Boston area who were
between 30 and 65 years of age, and who had a brother still
living in Ireland were contacted and, if willing to cooperate,
were enrolled. Each was given a form letter to post to his
brother in Ireland and the latter was contacted by staff from the
Department of Social Medicine of Trinity College in Dublin. In
this manner a total of 1154 brothers, all matched, each within
ten years of the other’s age, were enrolled and
examined.
As the study progressed, it became evident that the majority
of the brothers in Ireland were rural farm workers, whereas the
Boston brothers lived and worked in a large urban area. Because
even within countries there are differences in the incidence of
arteriosclerotic heart disease between urban and rural men, it
was decided to enroll a group of urban subjects in Ireland for
comparison with the rural brothers and the urban subject in
Boston. Accordingly, we secured the cooperation of C.I.E. (the
Irish transport company) and of Guinness’s Brewery. As a
result 151 transport and 161 brewery workers living in Dublin
were enrolled.
Evidence such as that in which U.S. servicemen killed in Korea
at an average age of 22 years were found to have arterial
atherosclerotic lesions [8], indicates that the physical findings
related to this condition in middle age are a reflection not only
of factors at play during earlier adult life, but also those
during childhood. Because our Boston brothers had mainly come to
the United States when they were over 20 years of age, all would
have been affected by dietary and environmental factors both
while in Ireland and while in the United States. For this reason,
a sample of comparable men, both of whose parents were born in
Ireland, but who had themselves been born in the United States,
was sought. This group we called ‘First Generation’
and in all 376 of these men were enrolled.
A sixth group in the study was a group of rural Irish who were
not brothers of the Boston subjects. These 152 men were enrolled
in order to provide a better basis for urban-rural comparisons in
Ireland.
The six groups of men in the study (and they have been labeled
thus) are: 1. First Generation, 2. Boston Brothers, 3. Irish
Brothers, 4. Guinness Workers, 5. Transport Workers, 6. Rural
(non-brothers). A total of 1994 men are included in the study
(see table I).
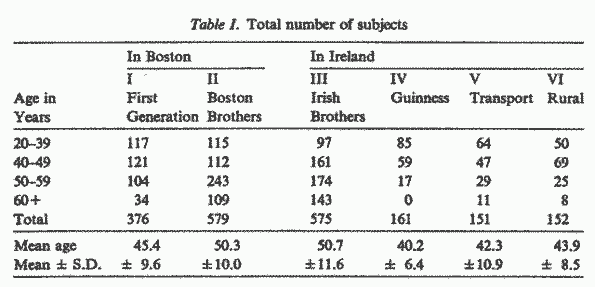
This paper describes the methods used and the results obtained
from dietary interviews, physical examination, anthropometric
measurements, electrocardiograph readings, serum cholesterol
estimations and questioning on alcohol consumption and cigarette
smoking in 1994 men in the six study groups. Besides the
examination and interview of these groups of subjects, two other
studies were conducted to help broaden the picture. In the first
a comparison has been made of mortality data in Ireland with that
of persons dying in Massachusetts who are Irish born or born in
the United States of Irish born parents. In the second study,
coronary arteries and aortas were collected in Ireland and from
Irish subjects coming to autopsy in Boston. These have been
compared for their extent of atherosclerotic involvement.
It is known that the incidence of arteriosclerotic heart
disease has increased significantly over the past several decades
in many countries of the world, including the United States and
Ireland. Furthermore, the results of animal and human
experimentation have suggested that diet may alter not only lipid
levels but also cardiovascular morbidity and mortality. Many
dietary components, particularly fat and carbohydrate, have been
implicated. Other dietary factors have been considered including
total calories, the amount of cholesterol, type and amount of
protein and carbohydrate, fiber content, minerals and trace
elements.
The ever increasing body of evidence that dietary factors may
be associated with the development of cardiovascular disease has
stimulated interest in changes in diet composition over the
years. A comparison of food available for human consumption in
Ireland [9-11] and the United States [12] during the past three
decades is given in table II. Four time periods have been
selected to show trends in food consumption in these two
countries.
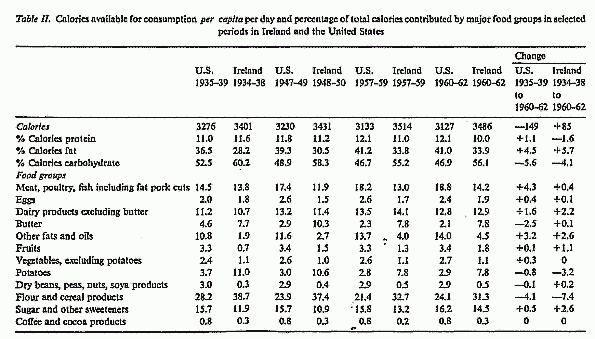
Ireland as indicated by FAO food balance sheets, has one of
the most plentiful food supplies in the world. The most recent
data available for Ireland, 1960-62, indicate a total of 3486
calories available per capita per day with fat providing
34% of total available calories. In the United States for the
same three year period, 3127 calories were available per
capita per day of which 41% (142 g) was from fat.
The principal differences in present food supply between these
two countries are that more cereals, potatoes and butter are
available in Ireland while more meat, edible oils (including
margarine and marine oils), fruits and vegetables are available
in the United States. Slightly more of the total calories in the
United States are provided by sugar and other sweeteners (16.2%)
than in Ireland (14.5%). More than twice as many calories are
available from potatoes in Ireland than in the United States
(7.8% vs. 2.9%), and Ireland obtains 31.3% of her calories from
flour and cereal products compared with 24.1% in the United
States. Dairy products excluding butter provide approximately 13%
of total calories in both countries, but over three times as many
of the total calories come from butter in Ireland than in the
United States (7.8% vs. 2.1%). Meat, poultry and fish contribute
more of the total calories in the United States (18.8%) than in
Ireland (14.2%). While Ireland, as stated, eats more butter, the
United States obtains more than three times as many of its
calories from other fats and oils (14.0%) than does Ireland
(4.5%).
There are without doubt regional and local differences in both
countries. Thus, farmers in Connemara eat differently from
brewers in Dublin. Similarly Boston businessmen do not eat the
same foods as cotton pickers in Mississippi. Estimates of the
actual quantities of various foods consumed by the subjects in
the Ireland-Boston study were obtained and the differences in
intakes of the important nutrients are given.
Changes in food availability in the United States and Ireland
over the past three decades are shown in table II. The general
trend, reflecting changes seen in reports of international
dietary intakes where economic development is occurring, has been
towards an increase in the percentage of calories provided by
fat, a decline in overall calories from carbohydrate, and a
replacement of some complex carbohydrate with simple sugar.
Protein
Protein contributed between 10 to 12.1% of the total calories in
both countries over the three decades, contributing slightly more
of the total calories (+ 1.1%) in the United States in 1960-62 as
compared with 1935-39. Conversely, a slight downward shift was
seen (-1.6%) in the calories provided by protein in Ireland over
this same period.
Fat
A number of investigators have considered the changing American
diet with special reference to fat [13-16]. According to food
availability data shown in table II, fat contributed 4.5% more of
the total calories in 1960-62 than in 1935-39. A similar increase
of 5.7% from fat is seen in Irish food availability data. An
intriguing observation reported by several investigators is a
shift upward in the P/S ratio (ratio of polyunsaturated to
saturated fatty acid) in the United States [17, 18]. ANTAR et
al. [17] in an analysis of fat from all food sources
available in the United States retail market, reported a small
increase in the P/S ratio from 1909 to 1961 (from 0.24 to 0.31%).
A similar trend in fatty acid availability was noted by CALL and
SANCHEZ [18]. The increased consumption of other fats and oils
reflected in table II is chiefly responsible for the change in
fatty acid composition of the American diet. Although much less
of these fats and oils is used in Ireland there has been a trend
upward over the years. Slightly fewer calories (0.9%) were
supplied by dairy products and butter in the United States, and
slightly more (2.2%) in Ireland in 1960-62 as compared with the
later 1930’s.
Cholesterol
ANTAR et al. [17] reported little change in supplies of
total cholesterol in the American diet. In 1909, 683 mg of
cholesterol were available per capita per day compared
with 734 mg in 1961, an increase of only 7.5%. The chief source
of dietary cholesterol is egg yolk and table II shows a slight
increase in total calories provided by this food in both the
United States and Ireland.
Carbohydrate
The amount of carbohydrate provided by the American diet is now
about a fourth lower than at the beginning of the century, with
about half of this decrease occurring since 1935-39.
Approximately 436 g of carbohydrate were available per
capita per day in 1935-39 compared with 374 g in 1960-62.
The change has been less marked in Ireland where 512 g were
available per capita per day in 1934-38 as contrasted to
489 g in 1960-62. The total percentage of calories provided by
carbohydrate decreased 5.6% in the United States and 4.1% in
Ireland (see table II).
The most marked change in carbohydrate consumption is the
shift in the proportion of carbohydrate provided by sugars.
FRIEND [19] reported that at the beginning of the century
two-thirds of the carbohydrate in the American diet was provided
by starch and one-third by sugars. The amount of carbohydrate in
the form of sugars increased to 43.2% in 193 5-39 and to 51.2% in
1965. A similar trend in changes in type of carbohydrate
available is noted in table II for Ireland. Potatoes and flour
and cereal products contribute a total of 10.6% fewer calories in
1960-62 than in 1934-38 in the Irish diet while consumption of
sugar and other sweeteners increased by 2.6%.
Magnesium
FRIEND [19] reported a decrease in magnesium available in the
United States, decreasing from 380 mg per capita per day
in the late 1930’s to 340 mg in 1965. The implications of
this have been reviewed [20]. The decreased use of grain products
is primarily responsible for this change. A similar decrease
would be expected in Ireland (see table II) with the decreased
consumption of cereal products.
Food availability data must be viewed with caution. Food
produced and available at retail is not the same as food
consumption. No allowance is made for spoilage, waste, and food
fed to domestic pets. In addition, they conceal variation in
intake of individuals. At best, these data provide an estimate of
trends in food consumption.
Table III compares mortality rates per 100,000 male population
in the United States and Ireland for the age groups 45-54 and
55-64. This shows that, for example, at age 55-64 deaths from
‘all causes’ were almost identical in the United
States and Ireland in 1950. However, for the same year there were
300 more deaths per 100,000 from arteriosclerotic and myocardial
heart disease (classification 420-422) in the United States than
in Ireland.

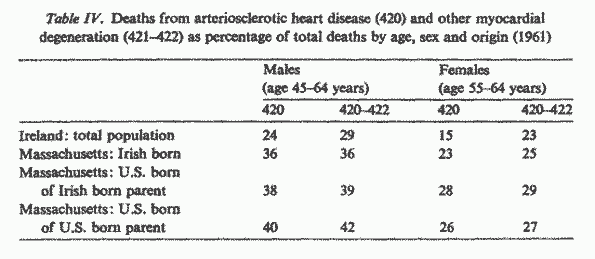
Perhaps the most meaningful and clear comparison can be
obtained by looking at the deaths due to these causes
(classification 420-422) as a percentage of total deaths rather
than by population. Table IV compares deaths in males aged 45-64.
This shows that 29% of deaths in Ireland and 42% in second
generation Americans in Massachusetts were due to this cause. The
figures in this table suggest a definite trend in mortality from
causes 420-422 in males. Irish born men living in Massachusetts
have a higher rate than do men living in Ireland, and United
States born men of Irish parentage have an even higher rate and
closely approach the second generation Americans in Massachusetts
in percentage of deaths from this cause. For women we have taken
the upper of the two decades because the disease is much commoner
in women between 55 and 64 than between 45 and 54 years of age.
The table shows a trend in females similar to, though less marked
than, that seen in males.
We realize that this type of comparison has disadvantages such
as differences in age distribution, in prevalence of other causes
of death, and in classification of death. Life expectation in the
two countries has been shown to be very similar.
The International List of Classification of Death was revised
in 1926 (3rd revision), in 1931 (4th revision), in 1940 (5th
revision), and in 1950 (6th revision). All these have affected
the classification of what is now ‘arteriosclerotic heart
disease’ (420) and ‘other myocardial
degeneration’ (421, 422). It is, however, possible to
distinguish and separate these two conditions from other causes
of death in all these classifications and therefore to make some
comparison of death rates over a forty year period in
Ireland.
When comparing deaths within a country the difficulties of
assignment of deaths by cause arise not only because of changes
in nomenclature but also because of changes in diagnosis. In the
case of heart disease there have, over the period, been
improvements in diagnostic technique, especially with the
introduction and increased use of the electrocardiograph. There
is also to be considered the question of what disease is
‘fashionable’ in any particular place and at any
particular time in history. The assignment of cases of sudden
death that do not come to autopsy will almost certainly be
influenced by this factor. All these matters deserve serious
consideration when looking at secular changes in mortality by
cause taken from death certificates.
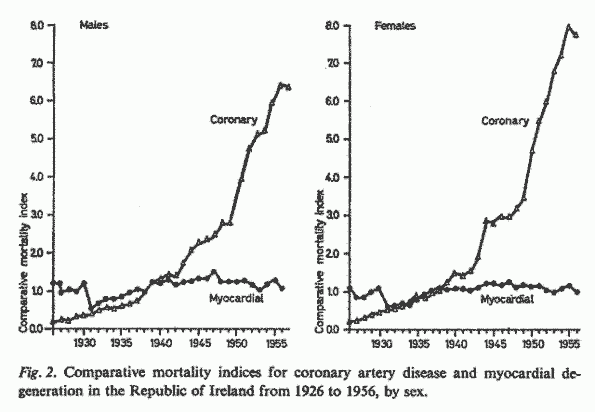
ACHESON and THORNTON [21] have reviewed the mortality from
coronary artery disease in Ireland between 1926 and 1955. They
mention that for every death in a man or a woman in the Republic
of Ireland certified as due to angina pectoris in 1926 over 30
deaths were attributed to angina pectoris or coronary heart
disease in 1956. They show that the secular increase in male and
female death rates has been approximately equal and uniform. In
contrast, comparative mortality indices for the group of diseases
now classed as myocardial degeneration show little change for the
period 1926-1956 for either sex.
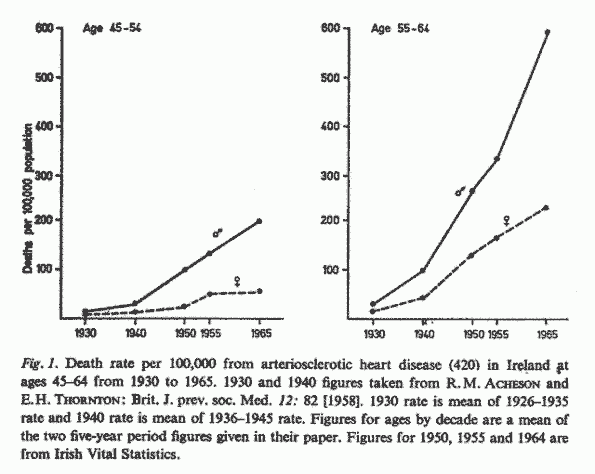
Fig. 1 shows the mortality per 100,000 from arteriosclerotic
heart disease in Ireland by sex in the age range 45-64. These
data compiled by ACHESON and THORNTON [21] have been updated with
our own more recent figures to 1965.
The rise in arteriosclerotic heart disease and the relatively
minor changes in deaths due to myocardial degeneration are
illustrated in fig. 2, which shows the comparative mortality
indices for these two causes of death with 1938 as the base year.
ACHESON and THORNTON showed that when these comparative mortality
indices for arteriosclerotic heart disease are plotted using a
logarithmic scale the rate of increase for females is rather
similar to that for males.
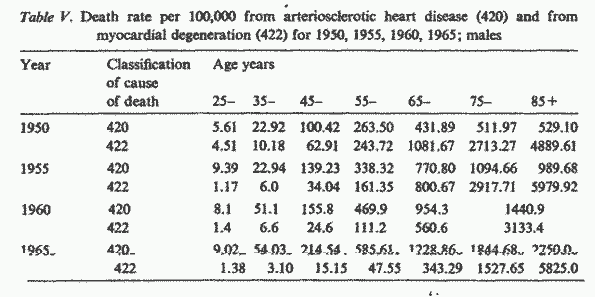
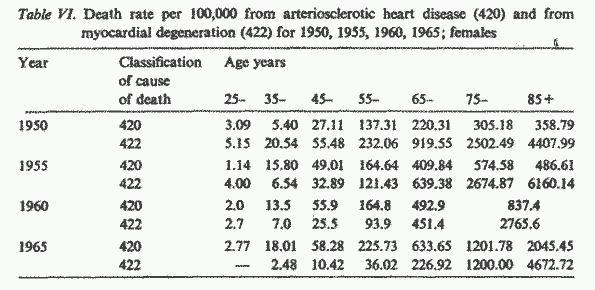
When comparing mortality figures in the period since the last
revision of classification of death and within the era of common
use of the electrocardiograph we see a continuing rise in deaths
attributed to arteriosclerotic heart disease. This is shown by
sex in tables V and VI. It can be seen that in males below 65
years of age the death rate from arteriosclerotic heart disease
has doubled between 1950 and 1965. In males above this age the
rate has increased even more steeply. Similar trends are shown
for females. It seems likely that in those over 65 a substantial
number of deaths previously assigned to ‘senility’
are now being assigned to the more fashionable coronary slot. The
figures for the younger age groups are therefore likely to show
more accurate trends in mortality rates from arteriosclerotic
heart disease.
Various epidemiological factors have been shown to be related
to arteriosclerotic heart disease including dietary factors,
cigarette smoking, activity and certain individual
characteristics such as age, sex, serum lipid levels, obesity,
body build, ECG abnormalities and blood pressure. This paper
reports some of the results obtained from dietary interviews,
physical examination, electrocardiograph readings and serum
cholesterol determinations of six groups of persons of Irish
stock. It will be recalled that two groups resided in the United
States, and the other groups in Ireland (see table I).
In all cases a careful dietary history was taken by a
nutritionist. A dietary schedule which gave qualitative and
quantitative information was used. The nutritionist also obtained
information relative to cigarette smoking and alcohol
consumption. A physician (cardiologist) obtained a personal and
family history and performed a physical examination. Among
others, measurements were made of height, weight, and skinfold
thickness. Blood pressure was measured and a twelve lead
electrocardiogram was obtained. Blood was taken for measurement
of serum cholesterol. All cholesterol estimations for subjects
both in Ireland and in Boston were performed in the same
laboratory. The nutritionists and physicians on both sides of the
Atlantic met on several occasions to standardize procedures and
to work with each other in both Ireland and Boston.
In the results which follow, data in each case refer to
findings on more or less the whole group. The only exception is
with dietary information. Histories designed to describe eating
patterns rather than actual nutrient composition of the dietaries
were obtained on a number of subjects. Therefore, data
comparative in terms of nutrients were available for about one-
third of the Guinness, two-thirds of First Generation and
three-quarters of subjects in the other four groups. In all
groups dietary information was obtained from a sample of adequate
size to allow meaningful comparisons to be made.
Table VII summarizes the intake of a number of dietary
components of the six groups of men in this study. The major
similarities noted are that fat provides approximately the same
per cent of total calories (about 38%) and that a similar per
cent of total calories is provided by saturated fatty acids for
each of the six groups.
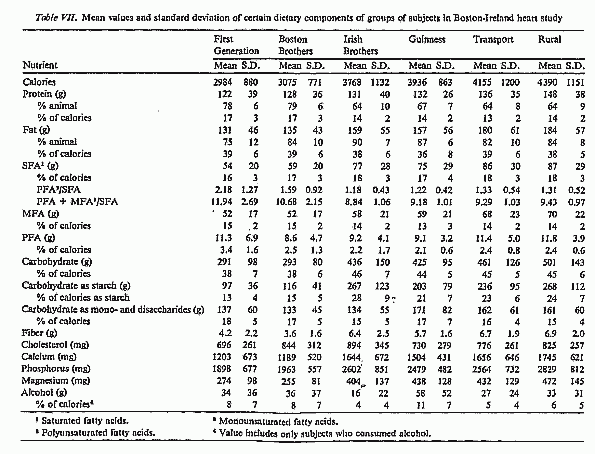
The chief differences between the diets of the Boston subjects
and the men in Ireland are:
1. The men in Ireland eat more. As shown in table VII the
Boston Brothers and the First Generation Irish consume an average
of about 3000 calories daily. The caloric intake of the various
groups in Ireland is between 700 to 1300 calories more per
day.
2. Both the ratio of the polyunsaturated fatty acids to
saturated fatty acids and the ratio of all unsaturated fatty
acids (mono- and polyunsaturated fatty acids) to saturated fatty
acids are slightly higher for the Boston subjects. The per cent
of total calories provided by the polyunsaturated fatty acids is
also slightly higher for these two groups.
3. In Ireland a greater per cent of total calories is supplied
by carbohydrate; slightly less by protein; and, with the
exception of the Guinness Workers, less by alcohol. The Guinness
Workers receive about 11% of their total calories from alcohol
compared with 4 to 6% for the other groups in Ireland and 8% for
the two Boston groups. Most of the alcohol consumed by the groups
in Ireland is stout and beer while more gin and whisky is used by
the Irish in Boston.
4. The diets of the men living in Ireland contain a greater
proportion of the carbohydrate as complex and less as simple
carbohydrates. The Guinness group had about 48% of their
carbohydrate as starch, Transport Workers 51%, Rural 53% and the
Irish Brothers 61%. The two groups in the United States received
much less of their carbohydrate as starch with the Boston
Brothers having 40% and the First Generation the lowest per cent,
33.
5. Calcium intake is greater by about 50% in the diets of the
men living in Ireland, chiefly because of a greater consumption
of milk. The ratio of calcium to phosphorus, however, is similar
for all groups ranging from 0.60 for the Boston Brothers,
Guinness and Rural groups to 0.65 for the Transport Workers.
6. The men living in Ireland have a higher magnesium intake,
ranging from 404 to 472 mg per day as compared with an intake of
255 mg daily by the Boston Brothers and 274 mg daily for the
First Generation Irish. This difference in magnesium intake is
due mainly to a greater consumption of whole grain cereals and
breads in Ireland. The greater consumption of these whole grain
products is also reflected in a larger amount of fiber and starch
in the diets of the men in Ireland. As shown in table VII, the
intake of both fiber and starch by the groups in Ireland is about
double that of the Boston groups.
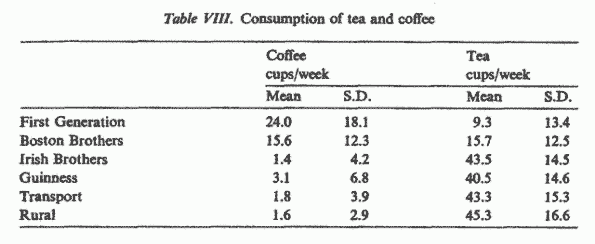
7. The men in Ireland drink more tea and less coffee than the
Boston subjects (table VIII). An average of 40 to 45 cups of tea
and only 1 /2 to 3 cups of coffee are consumed weekly by the men
in Ireland. The Boston Brothers drink an average of about 15 to
16 cups of tea and a similar amount of coffee each week. The
First Generation group have the highest coffee consumption of all
groups (24 cups per week) and the lowest tea consumption (about 9
cups per week).
Selected physical findings are summarized in table IX. A
number of other anthropometric measurements are reported later in
the paper.
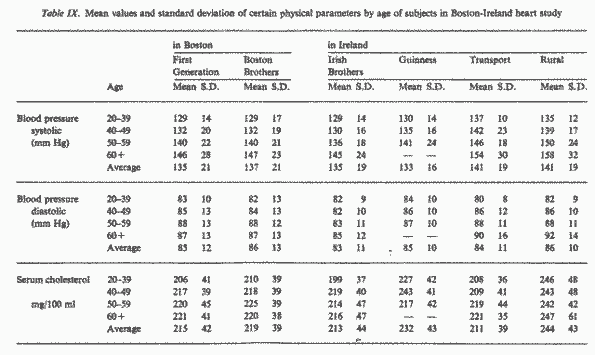
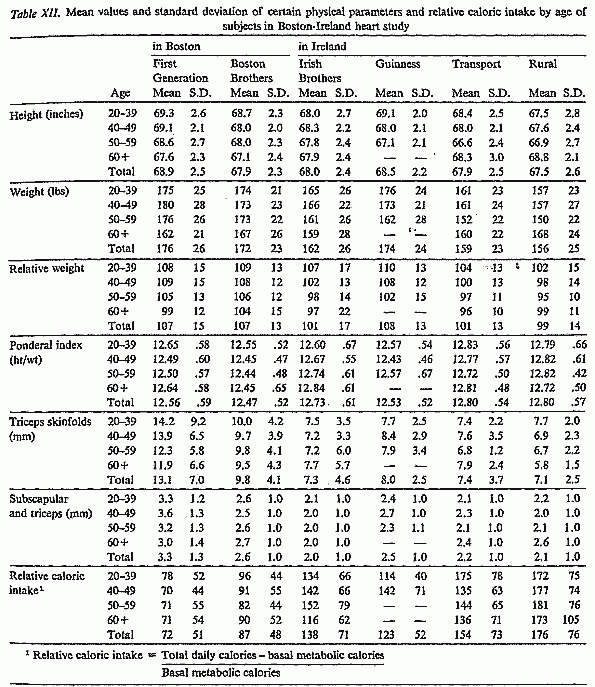
In looking at the parameters in table IX, the mean age of the
groups as mentioned earlier should be considered. The Irish and
Boston brothers’ groups are older with a mean age of about
50 years, which is 5 to 10 years higher than for the other four
groups and as is reported later in this paper, the First
Generation Irish are about one inch taller, on the average, than
the older groups.
The Boston Brothers, First Generation, and Guinness Workers
were found to have similar mean weights (172, 176 and 174 pounds
respectively) and to be from 10 to 20 pounds heavier than the
other three groups. The Irish Brothers’ mean weight is 162
pounds; Transport Workers and the Rural groups average 159 and
156 pounds respectively. These weight differences are reflected
in the relative weights of the groups with the Boston Brothers,
First Generation, and the Guinness groups having a relative
weight of 107 to 108 and the other three groups being very close
to their desirable weight with relative weights between 99 and
101. The ponderal index also points up the fact that the Boston
Brothers, First Generation and Guinness groups are heavier in
relation to their height than the other three groups of men.
The triceps skinfold measurement, considered the best single
predictive parameter in estimating obesity, shows some
interesting differences between groups. As expected from their
lower mean actual weight, relative weight, and ponderal index,
the Irish Brothers, Transport and Rural groups all have mean
triceps measurements (7.3, 7.7 and 7.1 mm respectively) less than
the Boston Brothers (9.8 mm), the First Generation (13.1 mm) and
the Guinness group (8.0 mm).
In comparing the First Generation and Guinness Workers, the
mean actual weights (176 pounds and 174 pounds respectively),
mean relative weights (107 vs. 108), and mean ponderal indices
(12.56 vs. 12.53) are similar. But, a marked difference in mean
triceps skinfold measurements was observed (13.1 mm for the First
Generation vs. 8.mm for Guinness Workers) which indicates a
greater incidence of obesity in the First Generation Irish.
Cigarette smoking was investigated. The mean number of
cigarettes smoked per day was higher in the two groups of men in
Boston than in the four groups in Ireland. The differences were,
however, not large. The heaviest smokers were the Boston
Brothers. Oddly, the Guinness Workers, who as a group had the
highest consumption of alcohol, smoked the least number of
cigarettes.
Table IX shows the systolic and diastolic blood pressure
readings by age in the various groups. Table X shows the number
and per cent of men in various groups at different ages in each
of three categories relative to blood pressure, i.e., normal,
borderline and hypertensive. In this table the rural groups
(Irish Brothers and Rural) were combined to compare against the
urban groups (Transport and Guinness). No important differences
were observed between groups.
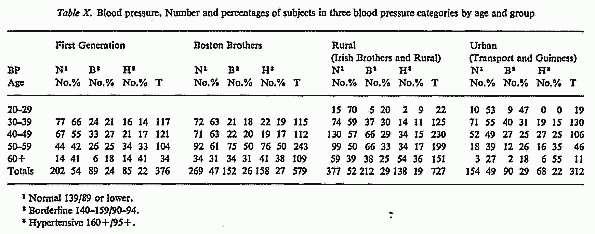
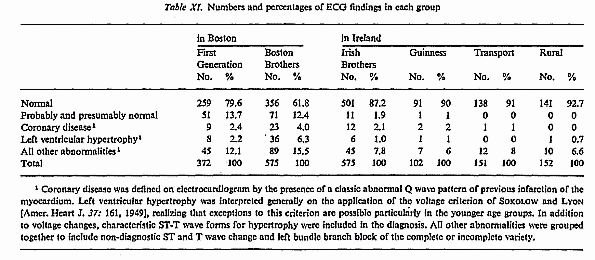
Table XI shows the results of the readings of the 12 lead
electrocardiogram. It is important to remember that the mean age
of the two brother samples was very close at about 50.5 years,
and the mean age of the other four groups was almost six years
younger. ECG abnormalities can be expected to increase with age.
Comparing the Irish and the Boston Brothers there were 575
ECG’s read in each group, yet evidence of coronary disease
was twice as common, left ventricular hypertrophy six times as
common, and all other abnormalities twice as common in the Boston
as compared with the Irish Brothers. In the same way the First
Generation men, who have lived their whole life in the United
States and who are a younger group than the Brothers, show many
more abnormal ECG findings than do equivalent rural or urban
subjects living in Ireland.
In the present study, the anthropometric data include four
measurements (height, weight, triceps and subscapular skinfolds),
and two derived indices (relative weight and ponderal index).
These data are available on six Irish or Irish-American groups,
two from the United States, the First Generation and Boston
Brothers, and four from Ireland, the Irish Brothers, the
Guinness, Transport and Rural groups (see table I).
The groups in the present study should, first of all, be
briefly compared with similar national populations in order to
obtain some idea of where they fall in the existing range of
general body size. The average stature of a nationwide
probability sample of adult males measured in the United States
in 1960-62 was 68.2 inches [22]. In the present study the
American-born First Generation group is 0.7 inch taller than this
standard (see table XII), a fairly marked difference, while the
Ireland-born, Boston-living Brothers are 0.3 inch shorter. In
Ireland, an extensive anthropometric survey made in the
1930’s showed a mean stature of 67.7 inches [23]. As
compared with this older Irish standard, the Irish Brothers from
the present study are 0.3 inch taller, Guinness Workers 0.8 inch
taller, Transport Workers 0.2 inch taller and the Rural group 0.2
inch shorter. If the continuing, apparently worldwide tendency
towards an increase in stature is taken into account, the
statures of the Irish groups in the present study would seem to
be fairly representative of the Irish population today.
With regard to weight, both groups in the present study who
live in the United States are heavier than the general U.S.
population, the First ration group by 10 pounds and the Boston
Brothers by 6 pounds. The present Irish groups, when compared
with the Irish measured in the 1930’s, are with one
exception heavier, as would be expected since they are generally
taller, the Guinness Workers by 17 pounds, the Irish Brothers by
5 pounds, and the Transport Workers by 2 pounds. The Irish Rural
group is lighter by 1 pound than the mean of 157 pounds found in
this earlier survey. With the exception of the Guinness Workers,
who are apparently somewhat atypical, the groups in this study
appear to be reasonably representative of the present Irish
population in regard to weight.
Since body dimensions vary with age, sometimes rather
considerably, it is important to note that the age composition of
the six groups in the present study differs somewhat. The
youngest group is the Irish Guinness Workers with an average age
of 40.2 years, while the oldest group is the Irish Brothers
living in Ireland with an average age of 50.7 years. This 10-year
difference in mean ages will have some effect on intergroup
comparisons. On the basis of the general U.S. population,
differences in height between populations with mean ages of 40
and 50 years would be expected to be about 0.3 inch, the older
group being the shorter, but virtually no difference should be
found in weight. The large series of males measured in Ireland in
the 1930’s showed a stature decline, also in cross
sectional data, of about 0.4 inch from 40 to 50 years, but again
almost no weight change. Differences in skinfold measurements as
a result of age changes between 40 and 50 years are small,
probably of the order of 1 to 2 mm at most, with the older being
the smaller.
However, mean age differences between most of the six groups
are less than 10 years. Two of the primary groups, for example,
show quite similar mean ages, the Irish Brothers with 50.7 years
and the Boston Brothers with 50.3 years. Again, where comparisons
are made between the same age subgroups of two different groups,
e.g., 40-49 years, the effect of age difference in the
distributions will be slight. For the most part, therefore, age
differences should not contribute substantially to differences in
the values of the anthropometric variables from group to
group.
All measurements were taken according to standard
anthropometric techniques as follows:
1. Height: except under field conditions when the
subjects were measured standing against a flat, upright surface
with a standard tape measure, all subjects were measured with an
anthropometer with subject standing free and erect, looking
straight ahead, shoes removed, feet flat on the floor. The
maximum vertical dimension to the highest point on the top of the
head, firm pressure with the horizontal bar of the anthropometer
to compress the hair.
2. Weight: taken with a standard balance-scale to the
nearest pound, subject wearing light indoor clothing without
shoes.
3. Triceps skinfold: taken at the back of the right
arm over the triceps muscle, midway between the most lateral
point on the acromion process of the scapula and the tip of the
elbow when at right angles using a Lange Caliper.
4. Subscapular skinfold: taken over the inferior
angle of the right scapula using a Lange Caliper.
5. Subscapular and triceps: the sum of the two
skinfolds as measured above.
The two indices were calculated as follows:
1. Relative weight: weight as measured, expressed as
a percentage of standard weights for age, sex and height
determined from the Medico-Actuarial Investigation of the
Metropolitan Life Insurance Company [24].
2. Ponderal index: height, in inches, divided by the
cube root of weight, in pounds.
Means and standard deviations for those six anthropometric
variables on the six groups are given in table XII. The data for
each of the groups are further subdivided by age as follows:
20-39, 40-49, 50-59 and 60 years and over.
The tallest of any of the groups measured was the First
Generation, the only one born in the United States. All others,
including all of the Boston Brothers, were born in Ireland. The
taller stature of this American-born group might have been
expected in view of the often observed increase in body size of
descendants of immigrants to this country [25-27]. In the present
context it is interesting to note that improved nutrition
following immigration has usually been offered as one of the
major reasons for this increase in gross body size. In the
present study the Boston Brothers and the Irish Brothers have
virtually identical statures, 67.9 and 68.0 inches, respectively.
Since all of the Boston Brothers were born in Ireland, and most
came to this country after the age of 20, they would have
achieved their full linear growth before immigration, hence the
stature increase observed in the First Generation group would not
be expected in the Boston Brothers, and, in fact, it is not
found. They are almost an inch shorter than those born in this
country of Irish descent. On the other hand, the virtual identity
in stature between the two groups of brothers would be expected
in view of the common genetic ancestry of each pair of brothers,
most of whom achieved full growth under similar environmental
conditions in Ireland.
The next tallest group is the Guinness Workers in Ireland who
have a mean stature of 68.5 inches; they are an urban group and
the youngest in the study. The Transport Workers, also urban, are
67.9 inches, the same as the Boston Brothers. The shortest of the
six groups is the Rural one at 67.5 inches. The overall stature
range for the six groups is from 68.9 (First Generation, U.S.) to
67.5 inches (Rural, Ireland).
The American-born, First Generation group has the highest mean
weight. In addition to being the tallest, they are also the
heaviest of any of the six groups measured, though at 176 pounds
they are only two pounds heavier than the Irish Guinness Workers,
the next heaviest. The Boston and Irish Brothers, though
virtually identical in stature, differ by 10 pounds in weight,
with the U.S. group the heavier of the two at 172 pounds. The
Irish Brothers at 162 pounds are heavier than their countrymen,
the Transport Workers, 159 pounds, and the Rural group, 156
pounds. The latter are the lightest as well as the shortest of
any of the groups measured.
When comparing all six groups the progression from heaviest to
lightest follows generally the same pattern as stature. Those who
are tallest tend also to be the heaviest, and vice versa. The
single exception is the above noted fairly marked difference
between the Boston and the Irish Brothers. Though the latter are
(insignificantly) taller, the former are markedly heavier.
In relative weight, the highest value, 108, is found among the
Irish Guinness Workers, with the two American groups, the First
Generation and the Boston Brothers, having a similar mean value
of 107. As in the case of weight, the Irish Brothers differ
significantly from their American kin with a lower mean relative
weight of 101, the same as that for the Irish Transport Workers.
The group with the lowest value, 99, is again the Irish Rurals.
Within each group there is a generally consistent drop in
relative weight with advancing age for each of the age subgroups.
The only exceptions are for the First Generation group where
there is a very small increase from 20-39 to 40-49, and the Rural
group where an increase at age 60 and above is based on only
eight subjects.
In considering the ponderal index, it must be remembered that
high values in this index tend to be associated with ectomorphy,
or relative absence of weight for height, while low values are
associated with endomorphy and/or mesomorphy, or a relatively
larger body bulk with reference to stature, whether due primarily
to fat in the case of endomorphy, or muscle and bone in the case
of mesomorphy. The ponderal index does not effectively
distinguish between these two components, except at very low
values where extreme endomorphy is indicated. This index has been
related to differences in mortality by SELTZER [28], but he found
no appreciable differences until values of about 12.3 or lower
were reached, and not until values of 11.6 or lower were
attained, i. e., the frankly obese, was there any significant
rise in mortality.
The Boston Brothers have the lowest ponderal index, 12.47,
though only slightly lower than that of the Irish Guinness
Workers at 12.53, and the U.S. First Generation group at 12.56.
The Irish Brothers have a mean ponderal index 12.73, or 0.26
units above their American relations. The two groups with the
highest values, i.e. those most linear in body build, are the
Irish Transport Workers and Rural group, both with a mean of
12.80. Intragroup age changes in this index show no uniformity or
pattern whatever.
The triceps skinfold is the one measurement or index that
shows a clear cut division between the two U.S.-living groups and
the four Ireland-living groups. The First Generation group has by
far the largest mean value for this measurement, 13.1 mm; the
next largest value, 9.8 mm, is displayed by the Boston Brothers.
The First Generation group, in fact, has a mean value fully 5.1
mm larger than any of the four groups presently living in
Ireland, none of whom have values exceeding 8 mm. These values
are, in descending order, Guinness, 8.0, Transport, 7.4, Irish
Brothers, 7.3, and Rural, 7.1. There are no very consistent or
striking age changes in body fat as measured by triceps skinfold
within or between any of the groups with the exception of the
First Generation, U.S.-born group where there is a consistent and
substantial decline with age. Even at their lowest values in the
60 and above age group, however, these Irish-Americans are still
a full 2 mm larger than the largest subgroup of any age, in any
of the other five groups.
Since the most marked between-group differences in any of the
anthropometric variables in the present study appear to be those
dealing with fat, it would be well to examine the significance of
these differences. The First Generation group have triceps
skinfolds significantly larger than the Boston Brothers, the next
largest, at age groups 30-39, 40-49 and 50-59 years, all at
levels of p <0.001. These Boston Brothers, in turn, have
significantly larger skinfolds than their Irish Brothers at these
same age groups, also at levels of p <0.001. The four groups
presently living in Ireland were relatively homogeneous with few
differences of any statistical significance; when the Irish
Brothers were compared with the other three groups, no t values
exceeded levels of p <0.2, while most were about 0.5.
When subscapular skinfold values are added to those of the
triceps for each subject a similar pattern emerges. The First
Generation group is again by far the largest, with a mean value
of 33.4 mm. The next largest is again the Boston Brothers at
26.0, but from here the gap to the Ireland born and living groups
is slight, 25.0 mm for the Guinness Workers. The other three
Irish groups are somewhat lower, 21.7 for the Transport Workers,
20.9 for the Rural group, and 20.1 for the Irish Brothers who
have the lowest combined subscapular and triceps skinfold values
of any of the six groups measured. Internal changes in this
combined measurement with age within the groups show no clear
pattern, and those that do occur are fairly small.
The most striking observation here, as in the case of the
triceps skinfold (which of course comprises one part of the
present values) is the substantially greater amount of body fat,
at least as indicated by the measurements taken at these two
sites, found on men of Irish ancestry who were born and raised in
this country. Their mean value is fully 8.4 mm larger than the
next ‘fattest’ group.
It is interesting to speculate on the relationships between
body fat, as evidenced by skinfold measurements, caloric intake
and activity. A common finding among obese persons is a decreased
tendency for muscular activity. Furthermore, it is generally
assumed that the relationship of food intake to exercise is one
of direct proportionality above the basal level corresponding to
inactivity. That this concept is an oversimplification at
variance with the facts has been shown by a number of
investigators. This is true only within certain limits of
‘normal’ activity. Below these levels, levels which
correspond to what can be termed ‘sedentary’, a
further decrease in activity may not be followed by a decreased
food intake but by a slight, but significant increase [29].
Furthermore, several researches [30-32] have reported that obese
individuals do not necessarily eat more than nonobese persons (in
fact may eat less), but a striking difference in activity has
been observed.
Earlier in this paper it was noted that the two groups of men
living in the United States ate the least, their intakes ranging
from 700 to 1400 calories less than the groups living in Ireland.
In spite of he lower intake, however, these two groups were the
‘fattest’ as indicated by skinfold measurements. The
lower intakes would be expected since both the observations of
the investigators and a crude assessment of activity levels of
the subjects indicated that the least active of the groups were
the two American-Irish groups with the First Generation being the
least active.
Since our assessment of activity was limited, an indirect
method for approximating the calorie expenditure of physical
activity in relation to basal metabolic needs was devised. Basal
metabolic calories were determined using the formula of HARRIS
and BENEDICT [33], H = 66.473 + 13.752 W + 5.003 S - 6.755 A.,
where H equals total heat production in 24 h, W equals weight in
kg, S = height in cm and A = age in years. Using the daily total
caloric intake (estimated from a research dietary history) and
the basal metabolic calories, an index was derived, Relative
Calorie Intake (RCI), using the following formula:
| RCI = |
Total daily calories - Basal
metabolic calories
Basal metabolic calories. |
The RCI for the six groups by age are shown in table XII. The
First Generation had the lowest RCI, 72, and the Boston
Brothers’ RCI was next lowest, 87. All groups in Ireland
had higher RCI’s, 123, 138, 154, and 176, for Guinness,
Irish Brothers, Transport and Rural respectively.
The First Generation group, the tallest, the heaviest, and the
‘fattest’ had significantly lower RCI’s than
the Irish Brothers, Transport Workers, Guinness Workers, or the
Rural group, usually at levels of p <0.001. They also have
lower values than their countrymen, the Boston Brothers, at p
<0.25 for 20-39 years and p <0.01 at 40-49 years.
Differences between the Irish Brothers and the other three
Ireland-dwelling groups showed no significant differences except
for the Rurals who had significantly higher RCI’s (p
<0.005) for the two youngest age groups, 20-39 and 40-49
years, perhaps not surprising in view of their environment and
occupation. The Boston Brothers, though fatter than their Irish
kin as measured by the triceps skinfold, had much lower
RCI’s (p <0.001) throughout the age ranges. Thus, in the
present study it would appear that increases in body fat are not
necessarily related to higher relative calorie intakes. There is,
in fact, an inverse relationship between these two variables for
these groups.
This inverse relationship between body fat and calorie intake
was also evident when the subjects from all six groups were
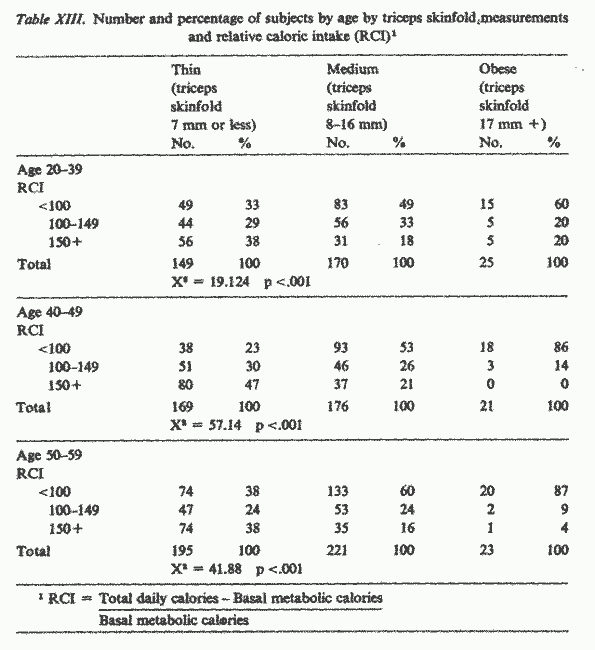
combined by age levels. Table XIII shows the number and
percentage of subjects by age who were ‘thin’,
‘medium’, or ‘obese’ as determined by
triceps skinfold measurements in relation to their relative
caloric intake. The inverse relationship between caloric intake
and body fat is clearly evident. Chi square was highly
significant (p <0.001) in each of three age levels, 20-39,
40-49, and 50-59. The same trend was noted in the 60 + age range,
but the number of subjects in some cells was too small to
determine chi square. Thus, it is evident that obese individuals
overeat in a relative sense in that their energy expenditure is
below their intake.
The main part of the Ireland-Boston heart study consisted of
the investigation of epidemiological and other factors related to
arteriosclerotic heart disease in six groups of subjects. A
pathology study was conducted in order to supplement these
findings and the comparative mortality statistics which had been
gathered. This was designed to ascertain the relative amounts of
arterial atherosclerosis in persons dying in Ireland and in Irish
subjects dying in Boston.
It was clear that even 1994 middle aged men would not have a
high enough mortality rate during the period of the study to
yield sufficient autopsy material for a comparative study of this
kind. It was also realised that collection of specimens from
study subjects who did die, would present an almost impossible
problem. Instead, then, random routine autopsies in two Irish
cities and in persons of Irish origin dying in Boston were used
for this part of the investigation.
A comparison was made of the extent and type of atheromatous
involvement of the aorta and of one branch of the coronary
vessels. These were taken from subjects, of both sexes and at any
age, coming to autopsy in Boston, Dublin and Galway. The results
that follow are taken therefore from examination of the arteries
of random subjects and not of those who were examined during life
as participants in the Ireland-Boston Heart Study.
The anterior descending ramus of the left coronary artery and
the aorta were obtained from unselected routine autopsies in
Dublin and Galway. Similar specimens were collected in Boston
from autopsies on subjects who themselves, or whose parents, had
been born in Ireland. For a previous comparative study specimens
had been collected from mixed Boston subjects. In all cases the
coronary artery and the aorta were opened longitudinally,
flattened, fixed in 10% formalin and preserved in transparent
plastic bags for review at a later date.
Atherosclerosis was assayed by the method of GORE and TEJADA
[34], an objective assay method which has been used in previous
comparative studies [35, 36]. Using this method the per cent of
the surface of the intima involved by all types of atheromatous
lesions was estimated and recorded for each vessel examined. The
relative proportion of the intimal surface involved in four types
of lesions, namely, lipid streaks, plaques, ulcerative and
calcific lesions, was then determined and expressed as a per cent
of the total intimal surface of the artery being examined.
These estimates were all made by one observer (Dr. GORE). In
order to be as objective as possible the cause of death, the sex
and the age of the subject were not known by the examiner at the
time of examination.
All the data are broken down into age groups by decade, but
include both male and female subjects. In Dublin and Galway
approximately two-thirds of the specimens were from males and
one-third from females, whereas in Boston almost exactly half
were males and half females. The Boston data are divided into two
parts: those from persons of Irish origin, collected for this
Boston-Ireland study, and those from mixed specimens of
undetermined national origin, collected for a previous study.
Total number of aortic specimens studied were Galway 250, Dublin
304, Boston Irish 403, and Boston Mixed 379.
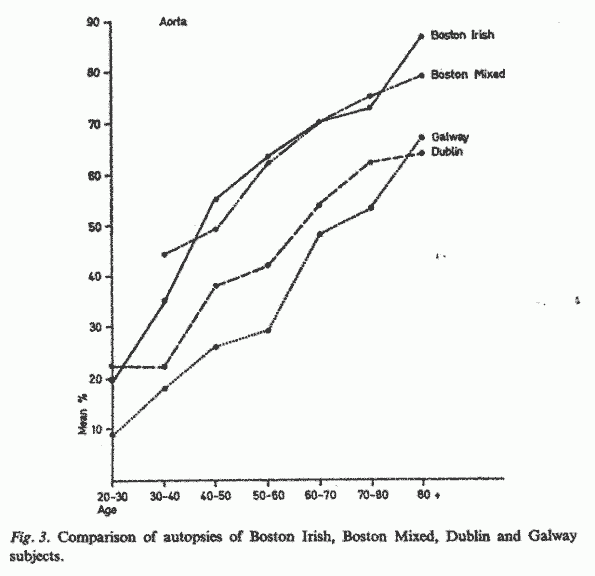
The results of the findings in the aorta are given in table
XIV. The graph in fig. 3 compares the mean extent of intimal
atheromatous involvement of the aorta in the four groups of
subjects. It can be seen that in every decade there is a higher
percentage of the intima involved in the Boston than in the Irish
subjects. A way of contrasting the extent of involvement is to
note from this graph the age at which 50% of the intimal surface
of the aorta is involved with atheromatous lesions. This occurs
at a mean age of 46 years in the Boston Irish, 61.5 in the Dublin
and 69 in the Galway subjects. Sixty per cent of the intima is
involved at a mean age of 52 years in the Boston Irish, at age 72
in the Dublin and at age 80 in the Galway subjects. Thus, taking
the mean aortic intimal involvement it can be seen that subjects
in Ireland have the same amount of involvement 15 to 28 years
later than their countrymen or descendants in Boston.
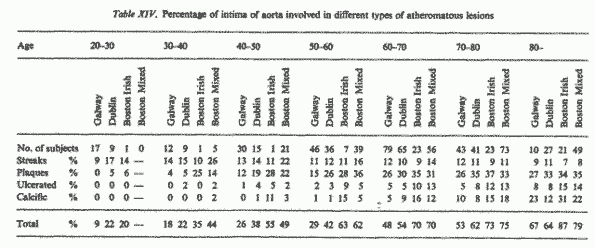
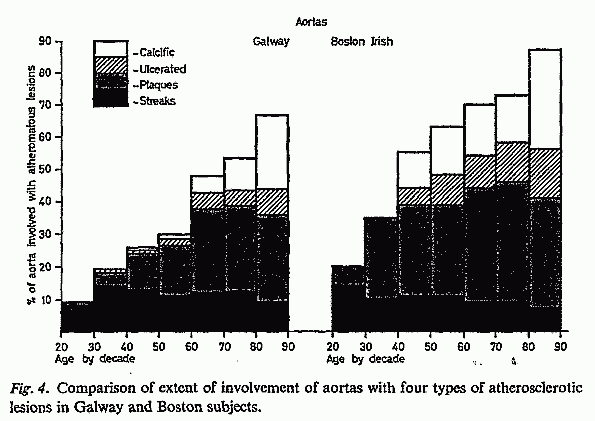
In the histograms (fig. 4) the different types of lesion found
in the aorta in the Boston Irish and Galway subjects are shown.
This shows that the extent of the early lesion, the lipid
streaks, is not too different in Galway and Boston, nor is there
much variation with age. However, the more serious or advanced
lesions, the plaques, the ulcerative and the calcific lesions,
are much more extensive in the Boston Irish than in the
Galwegians and in both groups they tend to increase with age.
Thus, at age 50 to 60 years both the Boston Irish and Galway
aortas have a mean of 11% of their intima involved with lipid
streaks. At this same age, only 15% of the aorta in the Galway
subjects compared with 28% of the Boston Irish subjects is
involved in plaque. However, taking advanced atheromatous
changes, there is over four times as much area involved in
ulcerated and 12 times as much in calcified lesions in the Boston
Irish as in the Galway subjects at this age. It can be seen from
table XIV that this is also true in general for the Dublin
subjects although the contrast is not quite as marked.
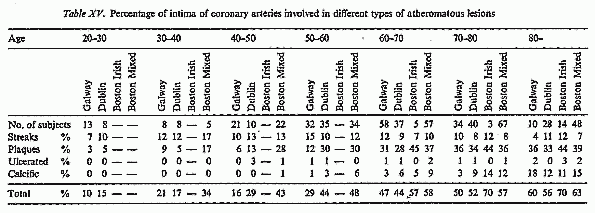
In the case of the coronary specimens, there were
unfortunately relatively few collected in the Boston Irish group
and none in the earlier decades. The number of coronary specimens
studied were Galway 176, Dublin 166, Boston Irish 22, and Boston
Mixed 233. The results of all the findings are shown in table XV.
The same trends can be seen as in the aortas, but the differences
between subjects dying in Boston and in Ireland are less marked.
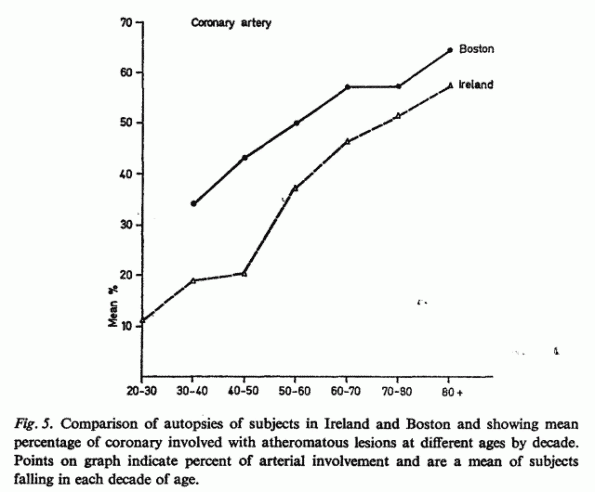
In the graph in fig. 5 the data from Boston Irish and Boston
Mixed subjects have been pooled and compared with those from the
Galway and Dublin subjects pooled in the same way. From this it
can be seen that a Boston subject has a mean of 40% of his
coronary involved in atheromatous lesions if he dies at age 42,
and in Ireland this amount of involvement is seen only at 59
years of age. A Boston subject has 50% involvement at age 55 and
an Irish subject at age 73. The coronary artery of the Bostonian
therefore has the appearance of that of an Irish subject 17 or 18
years older.
The autopsy findings confirm the mortality statistics and
clearly show much more atherosclerotic involvement of the aorta
and of the anterior descending ramus of the left coronary artery
at a similar age in subjects in Boston than in Ireland.
Equivalent extent and types of atheroma occur at a younger age in
Boston than in Ireland. The results also indicate greater
arterial involvement in Dublin than in Galway, a fact which
probably reflects urban-rural differences. Dublin is a much
larger city and is more industrialized than Galway. It is also
likely that more of the subjects who died in Galway than in
Dublin had lived most of their lives in rural areas.
In this study several interesting differences between the
diets of the men in the United States and the subjects in Ireland
were observed. The men in Ireland eat more total calories, yet,
with the exception of the Guinness group, weigh less than the
Irish in Boston. The obvious reason for these findings is that
the men in Ireland are much more active. The Guinness group,
although having nearly the same actual and relative weight as the
Boston groups, is clearly less obese, as is reflected in their
triceps skinfold measurements.
The serum cholesterol of the six groups does not differ
markedly; however, there is a trend toward higher levels of serum
cholesterol in the Guinness and Rural groups. This might be
expected since there is little difference in the per cent of
total calories provided by fat, in the per cent of calories from
saturated fatty acids, and in intake of dietary cholesterol
between groups. Interestingly, the lowest intake of dietary
cholesterol is in the First Generation Irish (696 mg daily) and
the Guinness Workers (730 mg daily). The two Boston groups have a
higher proportion of total unsaturated and polyunsaturated fatty
acids than all other groups.
The slight differences in the levels of serum cholesterol in
the groups in Ireland do not seem to be related to any
differences in the fat or cholesterol composition of the
diet.
A higher proportion of the carbohydrate in the diet in Ireland
was starch, ranging from an estimated 48% (Guinness Workers) to
61% (Irish Brothers), compared with 33% (First Generation) to 40%
(Boston Brothers). Previous studies have shown that the level of
serum cholesterol can be altered when starch is the principal
dietary carbohydrate; however, only small changes have been
observed and these only when starch constituted 75 to 80% of the
dietary carbohydrate [37].
A smaller proportion of the carbohydrate in the diet in
Ireland was in the form of mono- and disaccharides, ranging from
31% for the Irish Brothers to 40% for the Guinness group. The
Boston Brothers had 45% of the carbohydrate as simple sugars and
the First Generation had the highest per cent, 47. Whether these
differences in sugar consumption are of any significance is
unknown.
A low magnesium diet in animals has been shown to be
associated with soft tissue calcification [38-40]. The magnesium
intake of the Boston Brothers (255 mg daily) and the First
Generation Irish (274 mg daily) compared with the more generous
magnesium intake of the Irish groups (404-472 mg) may perhaps
explain in part the pathological findings already described.
The pathology findings show both more disease and more
extensive disease in Irish-born Bostonians than in men in
Ireland.
As was shown in table VIII, the groups in Ireland drink more
tea and less coffee, both of which have been shown to correlate
with the level of cholesterol and other fats in the serum. LITTLE
et al. have shown a positive correlation between amounts
of coffee consumed and levels of serum cholesterol in patients
with coronary heart disease [41]. They also found a negative
correlation between tea drinking and serum cholesterol levels in
subjects with coronary heart disease. PAUL. et al. [42]
have also reported a correlation between coffee drinking and the
later development of coronary heart disease. In our study, the
number of subjects with overt coronary heart disease is too small
for evaluation of the effects of tea and coffee drinking on
levels of serum cholesterol. However, although no significant
differences were observed in cholesterol levels of the subjects
in Ireland and Boston, as we have already mentioned, there is
evidence of more coronary heart disease in the Boston groups.
Tea contains fluoride in the ionized state, at a concentrate
of about 1 ppm [43, 44]. It has been shown by BERNSTEIN et
al. [3] that residents of areas with a high level of
fluoride in their water supply (4.0 to 5.8 ppm) had a lower
incidence of calcification of the aorta than residents living in
areas where the water contained low levels of fluoride (0.15 to
0.30 ppm). Moreover, fluoride seems to have a protective effect
in animals fed a low magnesium diet [45, 46]. However, more
research will have to be done before either magnesium or fluoride
deficiency can with confidence be incriminated as important
dietary factors in human arteriosclerosis.
With the marked differences in mortality and pathology, it is
perhaps surprising to find that the dietary intake and the
physical and related findings of the groups living in Ireland and
in Boston do not show even greater differences than those
discussed.
Perhaps of greatest significance is the fact that the Irish
brother, although consuming more calories, has an average weight
(and relative weight) lower than that of his Boston brother. The
Irish brother is clearly more active and is burning up his
calories. He is storing fewer of his calories as fat and this is
corroborated by the differences in the measurements of triceps
skin- fold thickness now generally regarded as the most reliable,
simple means of estimating body fat. Another significant
difference between the brothers is the much higher rate of
abnormal electrocardiographs in the Boston brothers. Therefore,
besides the greater amount of magnesium and fluoride (from tea)
in the diets in Ireland, greater physical activity, less obesity,
a greater intake of complex carbohydrates, and a lower amount of
cigarette smoking are all in favor of the Irish subject.
It must be remembered that the autopsy findings and the
mortality statistics are not those of the 1994 study subjects.
The relative lack of differences in the physical findings other
than electrocardiographs and the marked differences in autopsy
and mortality data may, in part, be explained by the recent rapid
increase in arteriosclerotic heart disease in Ireland. In the
1920’s and 1930’s Ireland had a predominantly rural
population which had not yet been greatly influenced by the
industrial revolution. Our mortality figures for the 1950’s
and 1960’s are a reflection of life during that period in
Ireland. In contrast, the middle aged men of today, who were our
study subjects, have changed their way of life considerably.
People have become more prosperous and even the farms have become
somewhat mechanized. People are performing less hard physical
work, they are smoking more cigarettes and the many factors which
a generation earlier increased the risk factors in England and
the United States are now beginning to affect men in Ireland. It
seems likely that, had this study been carried out in 1930,
marked physical differences would have been found between men in
Ireland and in the United States and that if the study were
repeated in 1990, assuming that present trends continue, probably
no differences would be detectable. Done in the intervening
period, the present study has shown marked differences in
mortality and autopsy findings and much smaller differences in
the physical factors related to arteriosclerotic heart
disease.
We do not conclude that these data are necessarily contrary to
or in validate previous studies which strongly implicate the
consumption of saturated fats and cholesterol and elevated levels
of serum cholesterol as important factors in the etiology of
coronary heart disease. In studies on the relationship between
the composition of dietary fat and serum cholesterol HEGSTED
et al. [47] found that the amount of fat was less
important than the composition of the dietary fat. Diets which
contained the same kind of fat produced similar levels of serum
cholesterol whether the fat supplied 25 or 40% of the total
calorie intake. Thus the higher total fat intake in Ireland is
not necessarily expected to produce higher levels of serum
cholesterol. The overall percentage of total calories supplied by
fat and the composition of the dietary fat in Ireland and Boston
is not greatly dissimilar. As in the Framingham studies [48]
dietary differences by themselves are probably insufficient to
demonstrate their etiologic role. In any event, the roles of the
many various etiologic factors are probably interdependent and
the significance of any one may depend upon a number of
environmental or genetic conditions. Although it is uncertain how
current dietary and environmental conditions in Ireland related
to the development of atherosclerotic heart disease which has
undoubtedly been influenced by events and conditions over a
considerable period of years, the implications of this study are
that food intake is of less importance when the subjects are
active and extra calories consumed are expended in physical
activity as was the case with the Irish brothers in Ireland. In a
future paper the data upon caloric intake, physical activity,
body size and skinfold measurements will be discussed in more
detail.
There is a higher mortality rate from arteriosclerotic heart
disease in Massachusetts than in Ireland. A comparative
epidemiological study of possibly related factors was made using
1994 middle aged men, including over 500 pairs of brothers, one
of whom lives in Ireland and the other in Boston. The intake of
calories, complex carbohydrates, magnesium and fluoride (from
tea) was higher in Ireland. The proportion of calories derived
from fat and saturated fat, the serum cholesterol, the blood
pressure levels and the amount of cigarette smoking did not
differ markedly. The weight, skin-fold thickness and number of
abnormal electrocardiograms were high in the Boston subjects. A
study of the pathology of coronaries and aortas from autopsies
revealed much earlier serious atheromatous involvement in the
Boston than in the Irish specimens. Increased physical activity
appears to be important in reducing the risk of coronary heart
disease in Ireland.
1. TRULSON, M.F.; CLANCY, R.E.; JESSOP, W.J.E.; CHILDERS, R.W.
and STARE, F.J.: Comparisons of siblings in Boston and Ireland.
J. amer. diet. Ass. 45: 225 (1964).
2. YUDKIN, J.: Dietary fat and dietary sugar in relation to
ischaemic heart disease and diabetes. Lancet ii: 4
(1964).
3. BERSTEIN, D. S.; SADOWSKY, N.; HEGSTED, D. M.; GURI, C. D.
and STARE, F. J.: Prevalence of osteoporosis in high and low
fluoride areas of North Dakota. J. amer. med. Ass. 198:
499 (1966).
4. MANN, G.V.; SHARPER, R.D.; ANDERSON, R.S. and SANDSTEAD,
H.H.: Cardiovascular disease in the Masai. J. Atheroscler. Res.
4: 289 (1964).
5. GORDON, T.: Mortality experience among the Japanese in the
United States, Hawaii, and Japan. Publ. Hlth Rep., Wash.
72: 543 (1957).
6. LARSEN, N. P.: Diet and atherosclerosis: a field study.
Arch. intern. Med. 100: 436 (1957).
7. KEYS, A.; KIMURA, N.; KUSUKAWA, A.; BRONTE-STEWART, B.;
LARSEN, N. and KEYS, M.H.: Lessons from serum cholesterol studies
in Japan, Hawaii and Los Angeles. Ann. intern. Med. 48:
83 (1958).
8. ENOS, W.F.; HOLMES, R.H. and BERGEN, J.: Coronary disease
among U.S. soldiers killed in action in Korea. J. amer. med. Ass.
152: 1090 (1953).
9. Food Supply. Time Series (Food and Agriculture Organization
of the United Nations, Rome 1960).
10. Food Balance Sheets. 1957-59 Average (Food and Agriculture
Organization of the United Nations, Rome 1963).
11. Food Balance Sheets. 1960-62 Average (Food and Agriculture
Organization of the United Nations, Rome 1966).
12. U.S. Food Consumption. Sources of data and trends,
1909-63. Economic Research Service, U.S. Dept. of Agriculture,
Statistical Bull. No. 364 (1965).
13. STAMLER, J.: Diet and atherosclerotic disease. IV.
Epidemiology of coronary heart disease in the United States. J.
amer. diet. Ass. 34: 1053 (1958).
14. TRULSON, M.F.: The American diet: past and present. Amer.
J. clin. Nutr. 7: 91 (1959).
15. STITT, K.: Nutritive value of diets today and fifty years
ago. J. amer. diet. Ass. 36: 433 (1960).
16. McCANN, M.B. and TRULS0N, M.F.: Our changing diet. J.
amer. diet. Ass. 33: 358 (1957).
17. ANTAR, M.A.; OHLSON, M.A. and HODGES, R.E.: Changes in
retail market food supplies in the United States in the last
seventy years in relation to the incidence of coronary heart
disease, with special reference to dietary carbohydrates and
essential fatty acids. Amer. J. clin. Nutr. 14: 169
(1964).
18. CALL, D.L. and SANCHEZ, A.M.: Trends in fat disappearance
in the United States, 1909-65. J. Nutr. 93: Suppl. 1/II:
1 (1967).
19. FRIEND, B.: Nutrients in United States food supply, a
review of trends. 1909-1913 to 1965. Amer. J. clin. Nutr.
20: 907 (1967).
20. SEELIG, M.S.: The requirement of magnesium by the normal
adult. Amer. J. clin. Nutr. 14: 342 (1964).
21. ACHESON, R.M. and THORNTON, E.H.: Mortality from coronary
artery disease and ‘myocardial degeneration’ in the
Republic of Ireland. Brit. J. prev. soc. Med. 12: 82
(1958).
22. STOUDT, H.W.; A.; McFARLAND, R.A. and ROBERTS, J.: Weight,
height and selected body dimensions of adults; United States,
1960-62. National Center for Health Statistics, Series 11, No. 8
(U.S. Government Printing Office, Washington, DC 1965).
23. HOOTON, E.A. and DUPERTUIS, C.W.: Age changes and
selective survival in Irish males. Studies in physical
anthropology, No. 2 (American Association of Physical
Anthropologists, 1951).
24. Medico-Actuarial Mortality Investigation, vol. 1
(Association of Life Insurance Medical Directors and Actuarial
Society of America, New York 1912).
25. BOAS, F.: Changes in bodily form of descendants of
immigrants (Columbia University Press, New York 1912).
26. SHAPIRO, H.L.: Migration and environment (Oxford
University Press, New York 1939).
27. LASKER, G.W.: Migration and physical differentiation. A
comparison of immigrant with American-born Chinese. Amer. J.
physic. Anthropol., N.S. 4: 273 (1946).
28. SELTZER, C.C.: Some re-evaluations of the build and blood
pressure study, 1959, as related to ponderal index, somatotype
and mortality. New Engl. J. Med. 274: 254 (1966).
29. MAYER, J.; MARSHALL, N.B.; VITALE, J.J.; CHRISTENSEN, J.
H.; MASHAYIKHI, M. B. and STARE, F.J.: Exercise, food intake and
body weight in normal rats and genetically obese adult mice.
Amer. J. Physiol. 177: 544 (1954).
30. MAYER, J.; ROY, P. and MITRA, K.P.: Relation between
caloric intake, body weight, and physical work: Studies in an
industrial male population in West Bengal. Amer. J. clin. Nutr.
4: 169 (1956).
31. HAMPTON, M.C.; HUENEMANN, R.L.; SHAPIRO, L.R. and
MITCHELL, B.W.: Caloric and nutrient intakes of teen-agers. J.
amer. diet. Ass. 50: 385 (1967).
32. STEFANIK, P.A.; HEALD, F.P. and MAYER, J.: Caloric intake
in relation to energy output of obese and non-obese adolescent
boys. Amer. J. clin. Nutr. 7: 55 (1959).
33. HARRIS, J.A. and BENEDICT, F.G.: A biometric study of
basal metabolism in men, Publ. No. 279 (Carnegie Institution of
Washington, 1919).
34. GORE, I. and TEJADA, C.: The quantitative appraisal of
atherosclerosis. Amer. J. Path. 33: 875 (1957).
35. GORE, I.; ROBERTSON, W.B.; HIRST, A. E.; HADLEY, G.G. and
KOSEKI, Y.: Geographic differences in the severity of aortic and
coronary atherosclerosis. Amer. J. Path. 36: 559
(1960).
36. HIRST, A.E.; PIYARTN, P. and GORE, I.: A comparison of
atherosclerosis of the aorta and coronary arteries in Bangkok and
Los Angeles. Amer. J. clin. Path. 38: 162(1962).
37. McGANDY, R.B.; HEGSTED, D. M. and STARE, F. J.: Dietary
fats, carbohydrates and atherosclerotic vascular disease. New
Engl. J. Med. 277: 417, 469 (1967).
38. CRAMER, W.: Experimental production of kidney lesions by
diet. Lancet ii: 174 (1932).
39. SCHNEEBERGER, E.E. and MORRISON, A.B.: The nephropathy of
experimental magnesium deficiency. Lab. Invest. 14: 674
(1965).
40. VITALE, J.J.; GUZMAN, C. and PELAYO, C.: Magnesium
deficiency in the Cebus monkey. Circulat. Res. 12: 642
(1963).
41. LITTLE, J.A.; SHANOFF, H. M.; CSIMA, A. and YANO, R.:
Coffee and serum lipids in coronary heart disease. Lancet
i: 732 (1966).
42. PAUL, O.; LEPPER, M. H.; PHELAN, W.H.; DUPERTUIS, C.W.;
MACMILLAN, A.; McKEAN, H. and PARK, H.: A longitudinal study of
coronary heart disease. Circulation 28: 20 (1963).
43. WALBLOTT, G.L.: Fluoride in food. Amer. J. clin. Nutr.
12: 455 (1963).
44. McCLURE, F.J.: Fluorine in foods. Survey of recent data.
Publ. Hlth Rept., Wash. 64: 1061 (1949).
45. PYKE, R.E.; HOEKSTRA, W.O. and PHILLIPS, P.H.: Effects of
fluoride on magnesium deficiency in the guinea pig. J. Nutr.
92: 311 (1967).
46. CHIEMCHAISRI, Y. and PHILLIPS, P. H.: Certain factors
including fluoride which affect magnesium calcinosis in the dog
and rat. J. Nutr. 86: 23 (1965).
47. HEGSTED, D.M.; McGANDY, R.B.; MYERS, M.L. and STARE, F.J.:
Quantitative effects of dietary fat on serum cholesterol in man.
Amer. J. clin. Nutr. 17: 281 (1965).
48. KAGAN, A.; DAWBER, T.R.; KANNEL, W.B. and REVOTSKIE, N.:
The Framingham Study. A prospective study of coronary heart
disease. Fed. Proc. 21: Suppl. 11: 52
(1962).
This page was first uploaded to The Magnesium Web Site on
September 18, 2002
http://www.mgwater.com/


